Automating Relevance Tuning for Event Search

Authored by: Zelal Gungordu and Delaine Wendling.

1 Background

Relevance tuning is the process of making incremental changes to a search algorithm to improve the ranking of search results to better meet the information needs and preferences of users. Ideally, each such change would improve the quality of results, which can be measured using engagement metrics by running online experiments.

Until recently, relevance tuning for event search at Eventbrite was entirely manual. We manually tuned the weights/boosts for different relevance signals used in our search algorithm1. We used offline search evaluation to measure the impact of changes against a test set using well-known search metrics such as precision@k, recall@k, mean reciprocal rank, expected reciprocal rank, and normalized discounted cumulative gain2. Finally, we ran online experiments to measure the impact of changes on engagement metrics such as click-through rate (CTR)3 and order conversion rate (CVR)4

There are a number of drawbacks to manual relevance tuning as summarized below:

  1. When we pick the different values to try out for a given weight/boost in an experiment, there’s no mechanism for us to verify that those are the best values to try. Consequently, when an experiment variant wins, there’s no way for us to verify that the value we chose for that variant is in fact the optimal value for that weight/boost. All we know is that the winning value did better than the other one(s) we tried.
  2. Once we pick a value for a given weight/boost through experimentation, we generally do not go back and try to fine-tune the same weight/boost again at a later time. Consequently, manual tuning doesn’t offer us a mechanism to capture any impact of changes in our index contents and/or user behavior, due to seasonality and/or trends, on the relative importance of relevance signals.
  3. Our search index includes events from over a dozen different countries. However, a manual tuning-based approach to search relevance is very much one-size-fits-all. For in-person events, we apply a geo-filter to make sure we only return events for the given user’s location. However, when it comes to ranking events, we use the exact same relevance signals with the exact same weight/boost values for any location. Consequently, there is no mechanism to capture the differences in content and/or user behavior between different countries or regions that may have an impact on the relative importance of relevance signals.

Now that we have summarized the manual approach to relevance tuning and its drawbacks, let’s discuss how automating relevance tuning can address these concerns.

1.1 Automating Relevance Tuning

Automating relevance tuning involves applying machine learning techniques to tune the weight/boost values of relevance signals through a technique called Learning to Rank. Learning to Rank (LTR), also known as Machine-Learned Ranking (MLR), is the application of machine learning (ML) in training and using models for ranking optimization in search systems5. Instead of manually tuning weight/boost values for relevance signals, the LTR process trains an ML model that can learn the relative importance of signals from the index contents and training data, which consists of relevance judgments (i.e., search queries mapped to correctly-ranked lists of documents). The resulting model is then used at query time to score search results.

LTR can leverage either explicit relevance judgments (using manually labeled training data) or implicit judgments (derived from user signals such as clicks and orders). Using implicit judgments is a better fit for us for the following reasons:

  1. Curating explicit judgments at a scale to support effective LTR can be very time-consuming and expensive.
  2. Our search index is fairly dynamic in that we have new events created on a regular basis while old events get purged as they become obsolete. Typically, the index contents change completely every six months. If we were to use explicit judgments, we would need to gather them on a fairly regular basis to make sure they don’t go stale as the index contents change.
  3. Using implicit judgments based on user signals allows us to train a model that optimizes relevance to improve user experience rather than someone’s perception of relevance expressed through explicit judgments. Note that user signals may give us clues beyond whether an event is relevant to a search query based on its title and description. We may be able to determine how much other factors like event quality, date, and location weigh in on users’ decisions to engage with an event.

By using implicit judgments based on user signals, we essentially introduce a self-learning feedback loop in our search system where our users’ interactions with search results help the system self-tune its results to improve future user experience.

Now that we have defined what we mean by automating relevance tuning, let’s go back to the drawbacks we listed in the previous section for manual relevance tuning and explain how LTR using implicit judgments help us address those concerns.

  1. LTR frames relevance tuning as an optimization problem. We essentially optimize relevance against an objective function6 while trying to maximize the value of our chosen relevance metric7. Consequently, the model learns through the training process the optimal weight/boost values for the relevance signals within the problem space we define during training, which consists of the training data derived from implicit judgments, the index contents and the list of features we choose for our model (i.e., relevance signals).
  2. Using implicit judgments based on user signals help us capture the latest trends in user behavior. We have the ability to automate training new models on a regular basis – on a cadence determined by  business needs – to capture the latest trends in user behavior as well as our index contents.
  3. Instead of a one-size-fits-all approach to relevance tuning, we can train different models for different locations (countries or regions) as long as there’s sufficient user traffic to help derive reliable relevance judgments for those locations. This is possible because LTR using implicit judgments is completely language-agnostic, since the training data is derived from user signals.

1.2 Deriving Relevance Judgments from Implicit Feedback

We have talked about using user signals to derive implicit relevance judgments. Note that using raw user signals to derive relevance judgments is prone to a number of problems.

  1. Users are more likely to click on higher ranked search results than lower ranked ones because they intuitively trust the search system’s judgment on relevance. This is known as position bias.
  2. Using a simple metric like CTR results in search results with fewer user interactions leading to less reliable judgment outcomes than those with more interactions.
  3. If search never surfaces certain events in the first place, users will not get a chance to interact with them. So, those events will never get a chance to accrue user signal data.

For these reasons, rather than using raw signals, it is common to use click models to derive relevance judgments from user signals. Click models are probabilistic models of user behavior that aim to predict future user behavioral patterns by analyzing historical signal data8. They provide a reliable way to translate implicit signals into unbiased relevance judgment labels.

2 Our Approach to Automating Relevance Tuning

In this section, we summarize our approach to automating relevance tuning for event search.

We use the OpenSearch LTR plugin for automating relevance tuning. This is an open-source plugin available for all OpenSearch distributions. It’s also one of the plugins supported by Amazon OpenSearch Service. With this plugin, judgment list generation, training data preparation, and model training take place outside of Amazon OpenSearch Service. Once a model is trained, it is deployed to OpenSearch and stored in the same OpenSearch cluster as the search index. Using the model at query time involves performing a request with a special query type supported by the LTR plugin called sltr query – which takes the query keywords and the name of the model to use to score results. This is done within the context of an OpenSearch rescore query. In this case, the query part of the request is used to retrieve and rank results using the BM25 scoring function in the usual way9. Then, the top k results following BM25 ranking are rescored/reranked using the LTR model specified in the sltr query. The LTR model is used only in the rescoring phase because it’s a more expensive scoring technique than BM25 scoring.

2.1 Using the OpenSearch LTR Plugin

As mentioned earlier in this section, with the LTR plugin, judgment list generation, training data preparation, and model training takes place outside of Amazon OpenSearch Service. This section explains training data preparation and model training. The best resource to understand how to work with the LTR plugin is the documentation for the Elasticsearch LTR plugin. The OpenSearch LTR plugin is just a fork of the Elasticsearch plugin. In this section, we will summarize some of the information from that documentation. The reader is advised to read the documentation itself if interested in finding out more about the plugin. Another good resource for this plugin is the hello-ltr Python repo that illustrates how to use the Elasticsearch LTR plugin.

Training Data Preparation

This section of the plugin documentation explains the key concepts used by the LTR plugin. There are two types of input that are required for LTR training data preparation:

  • Judgment lists: Judgment lists are collections of grades for individual search results for a given set of search queries. The following is a sample pseudo-judgments list for event search:

This sample file follows the LibSVM format commonly used by LTR systems. Note that the exact format we use is flexible (as long as the code we use to parse the judgments list file is in line with the format requirements). The information required for each judgment tuple consists of the search query in question, the document ID in question and how relevant that document is to that query, i.e., grade. In this sample, we are told that the event with the ID 7555 is very relevant to the search query jazz. The event title is included in the judgment only for human-readability purposes.

  • Features: Features are essentially the relevance signals we use in our search algorithm; e.g., title match, description match, event quality boost, etc. The LTR plugin expects features to be expressed as OpenSearch queries. For example, to use title match as a relevance signal we include a feature like the following:

Once we have defined our judgments list and features, the next step is logging features, which essentially means computing scores for each relevance feature based on the index contents. The resulting scores are used to annotate the judgments list to indicate the score for each feature in each judgment tuple. The resulting file would look something like the following snippet, assuming we have two relevance features: title_match and description_match.

This is the training data that is used to train an LTR model.

Training an LTR Model

The OpenSearch LTR plugin supports two libraries for training LTR models:

  1. RankLib: RankLib is a Java library that includes implementations of eight different LTR algorithms. It is relatively old and does not enjoy the same widespread use as the second option.
  2. XGBoost: XGBoost is an optimized distributed gradient boosting library that is very popular. It’s designed to be highly efficient, flexible and portable. It supports multiple languages, including a Python package.

We use XGBoost for LTR training. Note that XGBoost offers a variety of hyperparameters that can be tuned to improve model performance in a given problem space. A good rule of thumb is to start with the default values and apply some mechanism like grid search combined with cross validation to tune a subset of hyperparameters. Here’s a sample blog post that illustrates the process of hyperparameter tuning with XGBoost. The XGBoost hyperparameters for LTR are documented here.

Uploading an LTR Model to OpenSearch and Using it at Search Time

Once we train an LTR model, we upload it to our OpenSearch cluster. Note that one can upload and store multiple models on the cluster. The LTR plugin’s sltr query that’s used at search time takes a particular model as an argument. Hence, it’s possible to create and store different models for, say, different geographical regions, and then use the model corresponding to the given user’s location at search time.

2.2 LTR Architecture

A conceptual illustration depicting the process of automating relevance tuning for event search, showcasing interconnected nodes representing machine learning techniques, user signals, and search algorithms, symbolizing the optimization of search results for improved user experience.

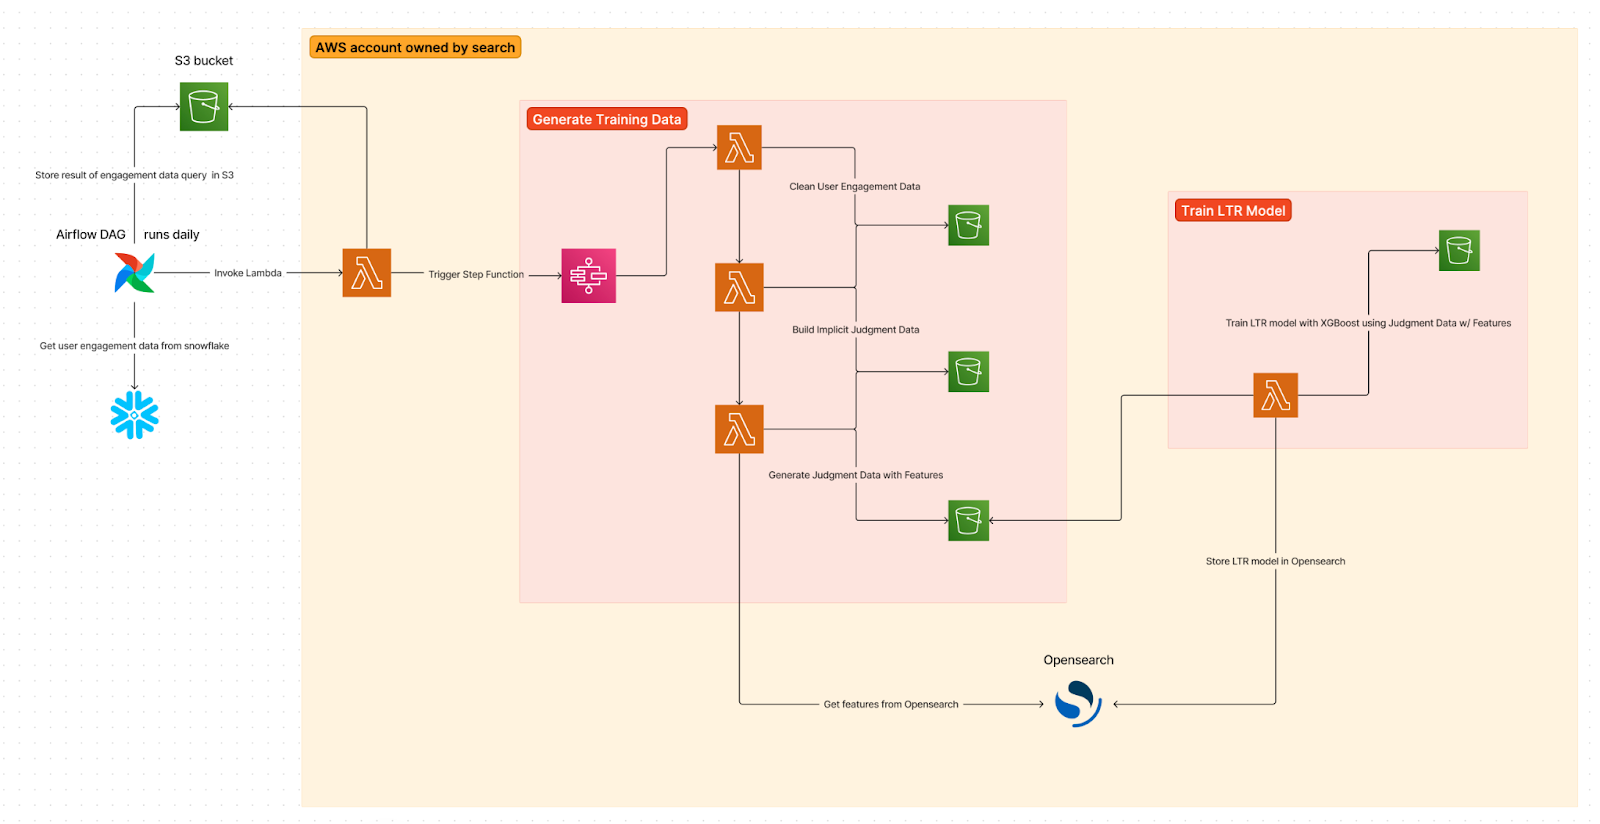
We use an Airflow Directed Acyclic Graph (DAG) to pull user signal data from a Snowflake table and transform it into a format from which we can generate implicit judgments. The DAG runs daily and invokes a Lambda function that triggers a Step Function. This Step Function orchestrates the invocation of three Lambdas that clean and reformat the user signal data, generate implicit judgments and call OpenSearch to compute the feature scores for each event mentioned in the implicit judgements. This process runs automatically every day.

We have a separate Lambda function that trains the LTR model and stores it in OpenSearch, as well as S3 for backup purposes. This Lambda function utilizes training data (implicit judgments with features) from a range of dates determined by the parameters passed to the Lambda to train the model. Once the model is uploaded to OpenSearch, it can be used at search time. Note that prior to rolling out a new model on our production systems, we perform offline evaluation against a test set using the well-known search metrics mentioned in Section 1. This helps us tune the rescore query window size used to decide how many of the top k search results we should rescore using the LTR model. It also helps us tune the rescore query weight used to weigh the relevance scores returned by the model while computing the overall relevance scores for search results. Finally, we run an online experiment where we start using the new model as part of search in one of the experiment variants and track our usual engagement metrics to measure the impact on user experience.

3 Future Work

We are still at the start of our journey for automating relevance tuning. We have many areas where we plan to iterate to improve our current approach.

One of the initial areas where we plan to invest in is improving our feature set. Currently, we use a limited number of features that consist of lexical features. We plan to expand this set to include embedding-based features to capture the semantic understanding of search queries.

So far, we have assumed that the LTR model would be used for requests with an actual search query. However, there’s a considerable amount of traffic on our site where the request lacks a search query. We call these requests queryless searches. For example, most of the traffic coming from the home page and other browse surfaces falls in this category. We plan to train separate models for queryless traffic since, without a search query, other relevance signals like date and event quality would have a bigger impact in ranking outcomes.

Another area of future work is to figure out when it would make sense to train location-specific models. Would it only make sense to have such models for different countries/regions, or is there enough variation in user behavior and/or index contents across multiple large metropolitan areas even within the same country to warrant them having their own models?

Note that so far we have focused on training generalized models of relevance. However, personalizing search results to better meet users’ specific information needs and preferences has proven to improve user engagement and satisfaction. Search personalization is an area we plan to focus on in the near future. Last but not least, traditional LTR approaches like the one we’ve described in this post are supervised ML approaches. They require handcrafted features based on query, document, and how well the two match each other. Over time, heavily engineered features can result in diminishing returns. Another future area of work is to augment the current approach with a neural LTR model. The advantage of neural LTR systems is that, instead of relying on handcrafted features, they allow feature representations to be learned directly from the data. This slide deck provides an overview of neural LTR. Tensorflow Ranking is a library that provides support for neural LTR techniques built on the Tensorflow platform. Generally speaking, neural LTR is recommended to be employed alongside traditional LTR systems in an ensemble setting (as opposed to replacing them) because the strengths of the two approaches are believed to complement each other.


  1. We use around two dozen relevance signals in our search algorithm, ranging from field boosts to ranking functions based on event quality, sales status, location and date.
  2. This blog post does a very nice job of explaining these metrics with easy-to-follow examples.
  3. Click-through rate (CTR) is the ratio of the number of clicks to the number of impressions.
  4. Order conversion rate (CVR) is the ratio of the number of orders to the number of clicks.
  5. There is a vast amount of literature on LTR. For a quick overview, see this Wikipedia page and this blog post.
  6. For more on objective functions used in LTR, see this blog post.
  7. For more on metrics typically used in LTR, see this Wikipedia page.
  8. For a thorough overview of click models, see Click Models for Web Search by Chuklin, Markov, and de Rijke.
  9. BM25 is OpenSearch’s default similarity function used to calculate relevance scores.

The Power of Collaboration in Product Development

Product development at Eventbrite is a practice centered around understanding what our customers need, so we can enhance current features or build new products. In order to achieve this, our product team collaborates across multiple disciplines throughout the company to ensure we’re thinking about customer needs from all angles.

Who is involved in product development?

At the heart of product development is collaboration. We unite knowledge and expertise from different teams across the company, including Research, Product Analytics, Product Marketing, Engineering, Design, and Product Management, to be able to make the most-informed decisions about what we can improve on and build for our customers. Our Customer Experience teams also play a critical role in providing important feedback from creators and attendees in the process.

What is the product development process itself?

Every day, our product development team gathers data and information about how our customers use and engage with the Eventbrite platform. We also have a research team that regularly surveys and interviews both creators and attendees to hear directly from them what’s working and what isn’t to uncover opportunities and key problems.

This includes analysis of purchasing and engagement patterns on our websites and mobile apps; review of direct customer feedback and app reviews; market research through customer interviews or surveys; and we also evaluate results from past initiatives to learn what has resonated with customers. 

Additionally, we conduct competitive research across the industry and of other best-in-class products to ensure we’re aligned with best practices, as well as identify opportunities to differentiate and innovate on our solutions. All of this evidence is gathered together and synthesized into clear product goals and problem statements to guide our development teams toward solving a common goal.

Our collaborative process in action

We recently launched changes to our checkout order form where creators can collect information from ticket buyers and ask them specific questions that could be useful for demographic or marketing purposes. However, because these questions were asked before a ticket buyer completes payment, this caused some friction for consumers in the checkout process and may have resulted in them not buying a ticket. This was the process for how we solved it:

Our design team facilitated a workshop where we leveraged “design sprint” techniques to brainstorm, prototype, and validate ideas. The whole cross-functional team came together to sketch ideas, discuss what will have the biggest impact on customers, and then validate them by showing draft ideas to users to get quick feedback. At this stage, our engineering team started to define the technical aspects of our implementation. 

Sketching ideas and defining technical aspects

As our development team started to hone in on the solution of moving certain aspects of the checkout order fields from before to after a consumer buys a ticket, we got input from various departments, including those in our customer teams, to ensure we’re thinking of different scenarios a user may face.

After various iterations, we arrived at an agreed-upon set of requirements that we then executed on. We frequently break this down into different phases of release to ensure we can deliver value to customers quickly. 

Eventbrite interdisciplinary teams

In this final phase before release, we tested the new order checkout form and created a rollout plan which introduced the feature smoothly to our platform. This includes preparing our customer teams with information and knowledge about the release so they can assist users with any questions they may have.

We usually build in a plan that allows us to pause a release and react immediately if any sort of issue gets detected. We also ran an A/B test and randomized the users who got exposure before or after checkout to measure objectively if it improved their experience, which is a tactic we typically use for any rollout. 

Post-checkout order form prototype tested with users

The most important aspect of releasing a feature is measuring the outcomes and iterating on it to make sure it is the best experience possible for customers. We may use the data from our A/B test or user feedback after release to develop the next set of enhancements. We always think back to the original customer problem we were trying to solve.

3 Questions With Sapna Nair — Eventbrite’s New VP of Engineering in India

Sapna Nair joins Eventbrite as our new Managing Director and Vice President of Engineering in India. Sapna is a dynamic leader who will lead Eventbrite’s expansion into India and add to our engineering expertise.

Her experience building distributed teams will accelerate hiring of top-tier talent in India, helping to deliver on our ambitious technical vision and high-growth business strategy.

Learn why Sapna chose Eventbrite and the approach she’s taking to build out her new team with these three questions.

Sapna Nair

Q. What attracted you to Eventbrite?

There are three reasons that attracted me to Eventbrite. First, I strongly believe that life is more enjoyable and meaningful when people come together for shared experiences. Eventbrite has built a phenomenal ecosystem that powers event creators all over the world to cultivate connection, build community, and scale their businesses.

Second, my discussions with all the leaders of Eventbrite were very candid, inspiring and confident. The leadership had a clear multi-year strategy for the accelerated growth of the company. They have such a strong belief in the mission of the company. The entire experience was so welcoming, indicating the oft-sought after people oriented culture, with a motivating vision.
Third, given the first two reasons, the opportunity to build and grow that same organization ground up in India was a rare chance to leverage my past skills and experience most effectively, and at the same time, I also continue to learn more through this journey.

Q. What excites you most about building and developing engineering teams?

I find the opportunity to define the best practices in people, process and technology, on a clean slate — with no bias or baggage — highly challenging and satisfying. Having said that, now contradicting my own earlier statement of having a clean slate, even though there is no bias or baggage for the specific team(s), there always exists a reference with respect to another team in another geography or another company. That makes the entire dynamics very interesting.

I love the enormous prospect it offers to coach managers and ICs. Building engineering teams comes with a lot of learning moments. Though I have done it numerous times in the past, every new cycle teaches me something new.

There is a very common impression that engineering teams are solely focussed on technology. That is true, but it is also true that engineering teams need to understand the purpose of the use of their technology. That is what triggers their innovation and inspires them to deliver their best. It means engineering teams must remain connected with the geographically distributed business teams and leadership.

I am exhilarated when, keeping engineering teams in front and center, I get to bring together all the stakeholders, across different cultures/time zones/accountabilities, with a common purpose of delighting our customers. Ultimately, the pride and satisfaction I see on the faces of our engineers is priceless, when they establish themselves as the CoE, surpassing
all the teething troubles!

Q: How do you prioritize your well-being in a remote-first environment?

Setting clear expectations starting with:
  • Remote-first does not equal to 24/7 availability.
  • Making my work hours known to all.
  • Defining everyone’s accountability
  • Defining rules of engagement with all the stakeholders
  • Empowering and encouraging others to manage their own flexibility, like declining meetings if it’s not convenient to them.

Advocating use of technology and automation as much as possible (like dashboards, Slack) to reduce online meeting fatigue and avoid information silos. Blocking slots in my calendar for my ‘Me-Time’.

Looking to join Sapna’s team? She’s hiring! Check out her open roles here.

Monitoring Your System

As Eventbrite engineering leans into team-owned infrastructure, or DevOps, we’re obviously learning a lot of new technologies in order to stand up our infrastructure, but owning the infrastructure also means it’s up to us to make sure that infrastructure is stable as we continue to release software. Obviously, the answer is that we need to own monitoring our services, but thinking about what and how to monitor your system requires a different type of mental muscle than day-today software engineering, so I thought it might be helpful to walk through a recent example of how we began monitoring a new service.

The Use-Case

My team recently launched our first production use-case for our new service hosted within our own infrastructure. This use-case was fairly small but vital, serving data to our permissioning service to help it build its permissions graph in its calculate_permissions endpoint. Although we were serving data to only a single client, this client is easily the most trafficked service in our portfolio (outside of the monolith we’re currently decomposing) and calculate_permissions processes around 2000 requests per second. Additionally, performance is paramount as said endpoint is used by a wide variety of services multiple times within a single user request, so t, so much so that the service has traditionally had direct database access, entirely circumventing the existing service we were re-architecting. We needed to ensure that our new service architecture could handle the load and performance demands of a direct database call. If this sounds like a daunting first use-case, you’re not wrong. We chose this use-case because it would be a great test for the primary advantage of the new service architecture: scalability.

The Dashboards

For our own service, we created a general dashboard for service-level metrics like latency, error rate and the performance of our infrastructure dependencies like our Application Load Balancer, ECS and DynamoDB. Additionally, we knew that in order for the ramp-up to be successful, we’d need to closely monitor not only our service’s performance, but even more importantly, we’d need to monitor our impact to the permissions service to which we were serving data. For that, we created another dashboard focused on the use case combining metrics from both our service and our client.

We tracked the performance of the relevant endpoints in both services to ensure we were meeting the target SLOs:

We added charts for our success metrics, in this case, we wanted to decrease the number of direct-database calls from the permissions service which we watched fall as we ramped up the new service.

We added metrics inside of our client code to measure how long the permission service was waiting on calls to our service. In the example below, you can see that the client-implementation was causing very erratic latency (which was not visible on the server side). Seeing this discrepancy in performance on the client and server sides, we detected an issue in our client implementation which had a dramatic impact on performance stability. We addressed this volatility by implementing connection pooling in the client. 

As the ramp-up progressed, we also added new charts to the dashboard as we tested various theories. For instance, our cache hit rate was underwhelming. We hypothesized that the format of the ramp up (percentage of requests) actually meant that low percentages would artificially lower our cache hit rate so we added this chart to compare the hit rate against similar time periods. It’s important to keep context in mind; fluctuations may be expected throughout the course of a day or week (I actually disabled the day-over-day comparison below because the previous day was a weekend and traffic was impacted as a result). This new chart made it very easy to confirm our suspicions.

This is just a sampling of the data we’re tracking and the metrics collection we implemented, but the important lesson is that your dashboard is a living project of its own and will evolve as you make new discoveries about your specific system. Are you processing batch jobs? Add metrics to compare how various batch sizes impact performance and how often you get requests with those batch sizes. Are you rolling out a big feature? Consider metrics that allow you to compare system behavior with and without your feature flag on. Think about what it means for your system or project to be successful and think about what additional metrics will help you quantify that impact.

Alerting

Monitoring is particularly great when launching a new system or feature and it can be very helpful when debugging problematic behavior, but for day-to-day operations you’re not likely to pour over your monitors very closely. Instead, it’s essential to be alerted when certain thresholds are approached or specific events happen. Use what you’ve learned during monitors to create meaningful alerts (or alarms).

Let’s revisit the monitor above that leveled out after a client configuration change.

I would probably like to know if something else causes the latency to increase that dramatically. We can see that the P95 latency leveled off around 17ms or so. Perhaps I’d start with an alert triggered when the P95 latency rises above 25ms. Depending on various parameters (time of day, normal usage spikes, etc.), maybe it’s possible for the P95 to spike that high without the need to sound the alarms, so I’d set up the alert to only fire when that performance is sustained over a 5 minute period. Maybe I set up that alert, and it goes off 5 times in the first week and we choose not to investigate based on other priorities. In that case, I should consider adapting the alerts (maybe increasing the threshold or span of time) to better align with my team’s priorities. Alerts should be actionable and the only thing worse than no alert, is an alert that trains your teams to ignore alerts.

Like with monitoring, there is no cookie-cutter solution for alerting. One team’s emergency may be business as usual for another team. You should think carefully about what is a meaningful alert to your team based on the robustness of the infrastructure, your real-world usage patterns and any SLA’s the team is responsible for upholding. Once you’re comfortable with your alerts, they’ll make great triggers for your on-call policies. Taking ownership over your own infrastructure takes a lot of work and can feel very daunting at first, but with these tools in place, you’re much more likely to enjoy the benefits of DevOps (like faster deployments and triage) and spend less time worrying.

Packaging generated code from protobuf files for gRPC Services

Background

At Eventbrite, we identified in our 3-year technical vision that one of our goals is to enable autonomous dev teams to own their code and architecture so as to be able to deliver reliable, high quality and cost effective solutions to our customers. However,  this autonomy does not mean that our team has to work in complete isolation from other teams in order to achieve their goals.

Over the past year, we have started our transition from our monolithic Django + Python approach to a microservices architecture; we selected gRPC as our low-latency protocol for inter-microservice communication. One of the main challenges that we face is sharing Protobuf files between teams for generating client libraries. We want it to be as easy as possible by avoiding unnecessary ceremonies and integrating into  team development cycles.

Challenges managing Protobuf definitions

Since our teams have full autonomy of their code and infrastructure, they will have to share Protobuf files. Multiple sharing  strategies are available, so we identified key questions:

Should we copy and paste .proto files in every repository where they are needed? This is not a good idea and could be frustrating for the consuming teams. We should avoid any error-prone or manual activity in favor of a fully automated process. This will drive consistency and reduce toil.

How will changes in .proto files impact clients? We  should implement a versioning strategy to support changes.

How do we communicate changes to clients? We need a common place to share multiple versions with other teams and adopt a standard header to client  expectations, such as Deprecation and Sunset.

Our proposed solution

We will maintain protobuf files within the owning service’s repository to simplify ownership. The code owners are responsible for generating the needed packages for their clients. Their CI/CD pipeline will automatically generate the library code from the protobuf file for each target language.

Packages will be published in a central place to be consumed by all client teams. Each package will be versioned for consistency and communication. Before deprecating and sunsetting any package version, all clients must  be notified and given enough time to upgrade.

Repository Structure

In our opinion, having a monorepo for all protobuf definitions would slow down the teams’ development cycles: each  modification to a Protobuf definition would require a PR to publish  the change in the monorepo, waiting for an approval  before  generating required  artifacts and distributing them to clients. Once the package was published, teams would have to update the package and publish a new version of their services. We need to keep the Protobuf files with  their owning service. 

Project Structure

The project’s organization should  provide a clear distinction between the services that exist in the project and the underlying Protobuf version that the package is implementing. The proto folder will hold the definition of each proto file with a correctly formed version using the package specifier. The service folder will hold the implementation of each gRPC service which is registered against the server. 

The proto folder will hold the definition of each proto file with a correctly formed version using the package specifier.

This approach will allow us to publish a v2 version of our service with breaking change, while we continue supporting the v1 version. We should take into consideration the next points when we publish a new version of our service:

  • Try to avoid breaking changes (Backward and forward compatibility)
  • Do not change the version unless making breaking changes.
  • Do change the version when making breaking changes.

Proto file validation

To make sure the proto files do not contain errors and to enforce good API design choices we recommend using Buf as a linter and a breaking change detector. It should be used on a daily basis as part of the development workflow, for example, by adding a pre-commit check to ensure our proto files do not contain any errors.

Following our “reduce toil over automation” principle, we added a task in our CI/CD pipelines in CircleCI. A Docker image is available to add some steps for linting and breaking change detection. It helps us to ensure that we publish error-free packages:

Following our “reduce toil over automation” principle, we added a task in our CI/CD pipelines in CircleCI.


If a developer pushes breaking changes or changes with linter problems, our CI/CD pipelines in CircleCI will fail as can be  seen in the pictures below:

breaking changes or changes with linter problems, our CI/CD pipelines in CircleCI will fail
Breaking changes or changes with linter problems, our CI/CD pipelines in CircleCI will fail.

Linter problems

Example Linter problems

Breaking changes

Example Breaking changes
Example breaking changes

Versioning packages

Another challenge is building and versioning artifacts from the protobuf file-generated code. We selected Semantic Versioning as a way to publish and release packages’ versions.

The package name should reflect the service name and follow the conventions established by the language, platform, framework and community.

Generating code for libraries

We have set up an automated process in CircleCI to generate code for libraries. Once a proto file is changed and tagged, CircleCI detects the changes and begins generating the code from the proto file.

We compile it using protoc. To avoid the burden of installing it, we use a Docker image that contains it. This facilitates our local development as well as CI/CD pipelines. Here is the CircleCI configurations:

We compile it using protoc. To avoid the burden of installing it, we use a Docker image that contains it.

In the previous example, we are generating code for python but it can also be generated for Java, Ruby, Go, Node, C#, etc.

Once code is generated and persisted into a CircleCI workspace it’s time to publish our package.

Publishing packages

This process could be overwhelming for teams if they had to figure out how to package and publish each artifact in all supported languages in our Golden Path. For this reason we took the same approach as docker-protoc and we dockerized a tool that we developed called protop.

Protop is a simple Python project that combines typer and cookiecutter to provide us a way to package the code into a library for each language. At the moment it only supports PyPI using Twine because our main codebase of consumers are in Python, but we are planning to addGradle support soon.

The use of protop is very similar to docker-protoc. We published a dockerized version of protop to an AWS Elastic Container Registry to allow teams to use it in their CI/CD pipelines in CircleCI:

We published a dockerized version of protop to an AWS Elastic Container Registry to allow teams to use it in their CI/CD pipelines in CircleCI

At Eventbrite we use AWS CodeArtifact  in order to store other internal libraries so we decided to re-use it to store our gRPC service libraries. You can see a diagram of the overall process below.

 AWS CodeArtifact  stores both internal libraries and our gRPC service libraries.
AWS CodeArtifact  stores both internal libraries and our gRPC service libraries.

This AWS CodeArtifact repository should be shared by all teams in order to have only one common place to find those packages instead of having to ask each team what repository they have stored their packages in and having lots of keys to access them.

The teams that want to consume those packages should configure their CI/CD pipelines to pull the libraries down from AWS CodeArtifact when their services are built.

This process will help us reduce the amount of time spent in service integration without diminishing the teams’ code ownership..

Using the packages

The last step is to use our package. With the package uploaded to AWS CodeArtifact, we need to update our Pipfile:

Updated PIp File to use the artifact.
Updated PIP File to use the artifact.

or requirements txt

Alternative way of using Protobuf files.

Conclusion

We started out by defining the challenges of managing Protobuf definitions at Eventbrite, explaining the key questions about where to store these definitions, how to manage changes and how to communicate those changes. We’ve also explained the repository and project structure.

Then, we proceed to cover protobuf validation using Buf as a linter and a breaking change detector in our CI/CD pipelines and how to version using Semantic Versioning as a way to publish and release packages’ versions.

After that, we’ve turned out to focus on how to generate, publish and consume our libraries as a kind of SDK for the service’s domain allowing other teams to consume gRPC services in a simple way..

But of course, this is the first iteration of the project and we are already planning actions to be more efficient and further reduce toil over automation. For example, we are working on generating the packages’ version automatically using something similar to Semantic Release to avoid teams having to update the package version manually and therefore avoiding error-prone interactions. 

To summarize, if you want to drastically reduce the time that teams waste on service integration avoiding a lot of manual errors, consider automating as much as you can the process of generating, publishing and consuming your gRPC client libraries.

Reflecting on Eventbrite’s Journey From Centralized Ops to DevOps

Once a scrappy startup, Eventbrite has quickly grown into the market leader for live event ticketing globally. Our technical stack changed during the first few years, but as with most things that reach production, pieces and patterns lingered. 

Over the years, we leaned heavily into a Django, Python, MySQL stack, and our monolith grew. We changed how our monolith was deployed and scaled as we went into the AWS cloud as an early adopter. This entailed building internal tooling and processes to solve specific problems we were facing, and doubling down on our internal tooling while the cloud matured around us. 

Keeping up with traffic bursts from high-demand events

Part of the fun and challenge of being a primary ticketing company is handling burst traffic from high traffic on-sales — these are high-demand events that generate traffic spikes when tickets are released to purchase at a specific time. Creators (how we refer to folks that host events) will often gate traffic externally, and post a direct link to an Eventbrite listing on a social network or their own websites. Traffic builds on these sites while customers wait for a link to be posted. The result is hundreds of thousands of customers hitting our site at once

Ten-plus years ago, this was incredibly difficult to solve, and it’s still a fun challenge from a speed of scale and cost perspective. Ultimately, challenges around the reliability of our monolithic architecture led to us investing in specialized engineering teams to help manually scale the site up during these traffic bursts as well as address the day-to-day maintenance and upkeep of the infrastructure we were running. 

A monolithic architecture isn’t a bad thing — it just means there are tradeoffs 

On one hand, our monolithic setup allowed us to move fast. Having some of Django’s core contributors helped us solve complex industry problems, such as high-volume on-sales in which small numbers of tickets go on sale to large numbers of customers. On the other hand, as we and our platform’s features grew, things became unwieldy, and we centralized our production and deployment maintenance in response to site incidents and bug triage. 

This led to us trying to break up the monolith. The result? Things got worse because we didn’t address the data layer and ended up with mini Django monoliths, which we incorrectly called services.

The decision to move from an Ops model to a DevOps model, and the hurdles along the way

Enter our three-year technical vision. In order to address our slowing developer velocity and improve our reliability, performance, and scale, we made an engineering-wide declaration to move away from an Ops model — in which a centralized team had all the keys to our infrastructure and our deployments— to a DevOps model in which each team had full ownership. 

An initial hurdle we had to jump over was a process hurdle. In order for teams to take any ownership, they’d have to be on call 24×7 for the services and code they owned. We had a small number of teams with production access that were on call, but the vast majority of our teams were not. This was an important moment in our ownership journey. And our engineering teams had many questions about the implications of what was not only a cultural but also a process change.

There are many technical hurdles to providing team-level ownership, and it’s tempting to get drawn into a “boil-the-ocean” moment and throw away all the historic learnings and business logic we developed over our history. Our primary building block towards team autonomy was leveraging a multi-AWS sub-account strategy. Using Terraform, we were able to build an account vending system allowing teams to design clear walls between their workloads, frontends, and services. With these walls in place each team had better control and visibility into the code they owned. 

Technical debt, generally, is a complicated ball of yarn to unwind

We had many centralized EC2-based data clusters: MySQL, Redis, Memcache, ElasticSearch, Kafka, etc. Migrating these to managed versions — and the transfer of ownership between our legacy centralized ownership directly to teams — required a high degree of cross-team coordination and focused team capacity. 

As an example, the migration of our primary MySQL cluster to Aurora required 60 engineers during the off-hours writer cutover — they  represented all of our development teams. The effort towards the decentralization of our data is leading us to develop full-featured infrastructure as code building blocks that teams can pull off the shelf to leverage the full capabilities of best-in-class managed data services.

Our systems powering our frontend as well as our backend services are process-wise similar to our data-ownership journey. We have examples of innovation around serverless compute patterns and new architectural approaches to address scale and reliability. We’re making big bets on some of our largest and most-impactful services — two of which still live as libraries in our core monolith. The learnings that are accrued through these efforts will power the second and third year of our three-year tech vision journey. 

The impact thus far, with more unlocks to come

By now, you’re probably realizing that at least some of our teams were shocked at the amount of change happening as their ownership responsibilities increased. We were confident that this short-term pain was worth it. After all, our teams were demanding this through direct feedback in our dev and culture surveys. 

The prize for us on this journey is customer value delivered through increased team velocity. While our monolithic architecture — both on the code and data sides of the house -— got us to where we are today, teams were not happy with their ability to bring change and improvements to things that they owned. This was frustrating for everyone involved, and the gold at the end of the rainbow for us is that teams can make fundamental changes with modern tools and processes. 

In the first year of our three-year technical vision big changes in ownership have been unlocked. As an example, we have migrated to Aurora where teams have ownership of their data. We’ve also provided direct team-level ownership of teams CI pipelines, improved our overall code coverage for testing, provided team autonomy for feature flag releases, and started re-architecting our two largest tier-1 services. It’s exciting to see new sets of challenges arise along the way — knowing these hurdles also unveil opportunities.

Crafting Eventbrite’s Data Vision

Data-driven decisions are the irrefutable holy grail for any company, especially one like Eventbrite, whose mission is to connect the world through live experiences.

I joined the Briteland to lead the Data Org, merging data-platform engineering, analytics engineering, product analytics, strategic insights and data science under one umbrella with a North Star of leveraging our scale and driving actionable insights from data.

When I first met fellow Britelings earlier this year, what immediately won me over was their infectious enthusiasm about the company’s mission, potential for impact — and, importantly, that data is a critical strategic asset to realizing Eventbrite’s vision.

Challenges and Opportunities

The Data Nerd in me couldn’t wait to uncover insights from this rich trove of data: social dynamics and the evolution of live experiences during and post the pandemic, regional microtrends, correlation to vaccinations rates, and so much more. 

However, to first get grounded in reality, I’ve had to play a couple of different roles. As a Data Lobbyist, I’ve been encouraging everyone, from our leaders to our engineers, to seek out data to guide their decisions. As a Data Therapist, I listen and learn from Britelings across all functions about the obstacles they encounter in gaining insights from data. Britelings’ current pain points broadly fall into three buckets: people, process, and technology.

People

Britelings are not aware of what data exists where, and how to start self-serving, especially when they may not have access to get started. As a result, “quick answers” aren’t quick enough, and thorough answers are even more time-consuming, especially when an analyst needs to spare cycles on techniques, tooling, or data semantics.

In addition, development teams are currently dependent on the data engineering team to aggregate and provide data for use in products. This does not align with our technical vision to have each development team own their solution end-to-end, including design, code, quality, deployment, monitoring, data, and infrastructure.

Focus areas: build data culture, remove knowledge silos

Process

There are multiple sources of truth (internal systems, data marts, etc.) that do not always reconcile. There are also several holes between data consumers and data producers in which context gets lost, and there’s a lack of standardized processes to define and update metrics.

Added to this, various manual processes are used for business-critical reporting due to legacy pipelines, data gaps, and incomplete context, causing transformation logic to be siloed with key employees rather than codified systematically with disciplined documentation.

Quick wins: align stakeholders, build end-to-end runbooks, alert proactively

Technology

Dated data infrastructure and stale models have been challenging to maintain and use. With insufficient isolation between production, development, and testing, some production pipelines have emerged as bottlenecks hindering quick iteration.

In addition, in the absence of consistent tooling and guidelines for getting data instrumented in products and integrated into existing pipelines, there are gaps in data coverage and quality that need to be addressed.

Slow down to speed up: modernize infrastructure, implement SDLC for data

These challenges are certainly not unique to Eventbrite; it’s an operational reality for businesses in the modern world. As a Data Leader, it’s heartening to know that Britelings are eager to lift barriers and invest in opportunities that deliver tangible value to our customers!

Goals

With a better understanding of where the gaps are across people, process, and technology, we set the following five goals:

  1. Provide a single source of truth with high-quality data for operational and financial reporting needs.  
  2. Provide tooling, training, and automation for Britelings to make informed decisions autonomously. 
  3. Provide reliable, resilient, scalable, and cost-effective data infrastructure.
  4. Make data more actionable to internal stakeholders, enabling a 360-degree perspective for strategic decisions.
  5. Make data actionable, insightful, and valuable to customers in-product — help creators grow their audience, help attendees find relevant events, and make the product more self-service. 

Tenets

To achieve these goals, we converged on tenets that would guide our execution, especially when confronted with tradeoffs.

  • Democratization over gatekeeping: We favor making data accessible to people (Britelings and Customers) and easier to create/collect more broadly to maximize creativity and value from data — but only within the boundaries of maintaining security and compliance.
  • Self-service over full-service: We will provide tools and consultation for people to better self-serve on data and not rely solely on a centralized team for insights.
  • Agility over uniformity: We believe in not blocking teams from their deliverables if they have a “good enough” option to run with sooner, and iteratively improve based on feedback. We will aim for developer autonomy.
  • Connect and enrich over clone and customize: We prefer to create and enrich modular datasets with additional context, annotations, information for consistent interpretation and use instead of making multiple copies that may eventually diverge and cause inaccuracies or confusion.
  • Comprehensive accuracy over partial freshness: We will prioritize having correct and complete information as of a (recent) point in time over up-to-date information that has not been vetted or reconciled, unless there is a use-case that demands otherwise.

Vision

With goals and ground rules established, we realize that the data team’s mission is to enable Creators, Attendees, and Britelings to self-serve on high-quality data at scale to derive actionable insights that drive business impact. 

It is our vision that: 

  • Creators obtain actionable insights to build their audience, increase ticket purchases, manage their events, and build loyalty amongst their attendees.
  • Attendees find interesting and relevant events from creators they trust. 
  • Britelings have accurate, timely, and actionable insights for operating the business, building better products, and delighting our creators and attendees.

In upcoming posts, we will talk about the Data Strategy and our plans to deliver on this vision. 

Creating the 3 Year Frontend Strategy

Last post we talked about Developing the 3 Year Frontend Vision, in this post we will go into how that vision, the tenets, requirements, and challenges shaped the Strategy moving forward.

One of the key themes in Eventbrite since I joined is DevOps, moving ownership from a single team who has been responsible for ops and distributing that responsibility to each individual team. To give them ownership over decisions, infrastructure, and to control their own destiny. The first step in defining the Strategy was to put together what a Technical Strategy is, and the foundation for that strategy.

Technical Strategy

The overall Technical Strategy is based on availability and ownership. Starting with the way we build our services and frontends, to the way we deploy and serve assets to our customers. The architecture is designed to reduce the blast radius of errors, increase our uptime, and give each team as much control over their space as possible.

Availability

Moving forward we will achieve High Availability (HA), in which our frontends and systems are resilient to faults and traffic, and will operate continuously without human intervention. In order to achieve HA, we will utilize Managed AWS Services or redundant fault tolerant software, and by utilizing content delivery networks (CDN) to increase our performance and resilience by putting our code as close to the customer as possible. We will ensure that all aspects of the system are tested, fault tolerant, and resilient, and that both the client-side and server-side gracefully degrade when downstream services fail.

Ownership

DevOps combines the traditional software development by one team and operations and infrastructure by another into a single team responsible for the full lifecycle of development and infrastructure management. This combination enables organizations to deliver applications at a higher velocity, evolving and improving their products at a faster pace than traditional split teams. The goal of DevOps is to shift the ownership of decision making from the management structure to the developers, improve processes, and remove unproductive barriers that have been put in place over the years.

Frontend

Once we had the foundation of the strategy defined, it was time to define the scope. To understand how to develop a strategy, or to even define one, we need to understand what makes up a “frontend”. In our case, the Frontend is everything from the backend service api calls to the customer. Because of this, we need to design a solution that allows for code to be run in a browser, on a server, service calls from a browser. Once you define the surface area of the solution, it becomes apparent that the scope and complexity of this problem is quickly compounding.

High Level Architecture

We need to define an architecture for everything above the red line in the above graphic. In order to simplify the design, I broke this down into three main areas; The UI Layer consisting of a micro-frontend framework with team built 

Custom Components, a shared Content Delivery Network (CDN) to front all customer facing pages, and a deployable set of bundled software that we code named Oberon, including a UI Rendering Service and a Backend-For-Frontend.

UI Layer

The UI leverages the micro-frontend architecture and modern web framework best practices to build frontends that leverage browser specifications while being resilient and team owned.

Micro-Frontend

When first approaching the micro-frontend architecture I realized that there is no clear definition of what a micro-frontend is.

Martin Fowler has a very high level definition which he states as

“An architectural style where independently deliverable frontend applications are composed into a greater whole”.

Xenon Stack describes a Micro-frontend as

“a Microservice Testing approach to front-end web development.”

Reading through the many opinions and definitions, I felt it was necessary to get a clearer understanding, and for everyone to agree what a micro-frontend architecture is. I worked with a couple of other Frontend Engineers to put together the following definition for a Micro-Frontend.

Definition

A Micro-Frontend is an Architecture for building reusable and shareable frontends. They are independently deployable, composable frontends made up of components which can stand on their own or be combined with other components to form a cohesive user experience. This architecture is generally supported by hosting a parent application which dynamically slots in child components. Components within a micro-frontend should not explicitly communicate with external entities, but instead publish and subscribe to state updates to maintain loose coupling. 

Micro-frontends are inspired by the move to microservices on the backend, bringing the same level of ownership and team independent development and delivery to the frontend.

Self-Contained Components

In order to avoid frontends that over time inadvertently tightly couple themselves and create fragile un-reusable components, we must build components that are encapsulated, isolated, and able to render without the requirement of any other component on the page. 

Component Rendering Pipeline

The Component Rendering pipeline renders components to the customer while the framework defines a set of Interfaces, Application Context, and a predictable state container for use across all of the rendering components.

State Management

State management is responsible for maintaining the application state, inter-component communication and API calls. State updates are unidirectional; updates trigger state changes which in turn invoke the appropriate components so they can act on the changes. 

Content Delivery Network

Our current architecture has resilience issues, where one portion of the site may become slow or unresponsive and that has a direct impact on the rest of the domain, and in many cases cause an overall site availability issue. In order to get around some of this issue, we add a CDN at the ingress of our call stack. Every downstream frontend rendering will contain Cache-Control headers, in order to control the caching of assets and pages in the CDN. During a site availability issue, the rendering fleet may increase the cache control header, caching for small amounts of time (60 seconds – 5 minutes max), for pages that don’t require dynamic rendering, or customer content. Thus taking load off the fleet and increasing it’s resource availability for other areas.

Oberon

Oberon is a collection of software and Infrastructure-as-Code (IaC) that enables teams to set up frontends quickly and to get in front of customers faster. It includes a configurable Gateway pre-configured for authentication as needed, a UI Rendering Service to server-side render UI’s, UI Asset Server to serve client side assets, and a stubbed out Backend-For-Frontend. 

Server Side UI Rendering Service

The UI Rendering Service defines a runtime environment for rendering applications, their components, and is responsible for serving pages to customers. The service maps incoming requests to applications and pages, gathers dependency bundles, and renders the layout to the customer. Oberon will leverage the traffic absorbing nature of a CDN with the scaling of a full serverless architecture. 

Backend-For-Frontends (BFF)

A BFF is part of the application layer, bridging the user experience and adding an abstraction layer over the backend microservices. This abstraction layer fills a gap that is inherent in the microservice architecture, where microservices must compete to be as generic as possible while the frontends need to be customer driven.  

BFFs are optimized for each specific user interface, resulting in a smaller, less complex, and faster than generic backend, allowing the frontend code to 1) limit over-requesting on the client, 2) to be simpler, and 3) see a unified version of the backend data. Each interface team will have a BFF, allowing them autonomy to control their own interface calls, giving them the ability to choose their own languages and deploy as early or as often as they would like.

Next Steps.

Now that we’ve published the 3 Year Frontend Strategy, the hard work begins. Over the next few months we will be defining the low level architecture of Oberon, and working on a Proof Of Concept that teams can start to leverage in early 2022.

Creating a 3 Year Frontend Vision

JC Fant IV
Oct-5th-2021

History

Over the course of the last 21 years I’ve spent time in nearly every aspect of the technical stack, however, I’ve always been drawn to the frontend as the best place to be able to impact customers. I’ve enjoyed the rapid iterations, and the ability to visualize those changes in the browser. It’s why I  spent much of the last 14 years prior to Eventbrite at Amazon (AWS) evangelizing the frontend stack. That passion led me to co-found one of the largest conferences internally to Amazon reaching over 7500 engineers across 6 continents. The conference is focused on all aspects of the Frontend, and helped to highlight technologies that teams could adopt and leverage to solve customer problems.

In March of 2021 I joined Eventbrite to help solve some of those same challenges that I’ve spent much of my career trying to solve. As part of my onboarding I was asked to ramp up on the current problem space and the technical challenges the company faces, and to dive into the issues impacting many of our frontend developers and designers. With all of that knowledge, I was tasked to come up with a 3 Year Frontend Strategy. 

Many of you have already read the first 3 posts in this series, Creating our 3 year technical vision, Writing our 3 year technical vision, and Writing our Golden Path. If you haven’t had a chance, those 3 posts help to set the context for how we defined and delivered our 3 year Frontend Strategy.

Current Challenges and Limitations

In those previous posts, Vivek Sagi and Daniel Micol described many of the problems that backend engineers, and engineers in general face at Eventbrite. My first task was to engage and listen to the Frontend Engineers around the company and to identify more specific frontend challenges and limitations that we face every day.

  • A monolithic architecture leads to teams having unnecessary dependencies and being forced to move at the speed of the monolith. They are often blocked by other changes or the release schedule of the monolith.
  • Our performance is suboptimal leading to some poor customer interfaces and low lighthouse scores. 
  • We lack automation in how we test, deploy, monitor and roll back our frontend code.
  • Our frontends are currently written in both a legacy framework and a more modern framework where the rendering patterns have diverged, and are no longer swappable without a migration. 
  • Service or datastore performance issues have a high blast radius where  all aspects of the site are degraded including pages that are static in nature.
  • Our front end experiences are inconsistent across our product portfolio and making changes to deliver against our 3-year self service strategy requires too much coordination.

Developing Requirements

Now that we had a decent understanding of the issues we’ve been facing, we turned our attention to understanding the requirements to solve these problems. 

  1. Features. As our product offering evolves to deliver high quality self-service experiences for creators and attendees, we ensure that our technology stack enables teams to efficiently create, optimize, and maintain the net new functionality we provide. 
  2. Performance. User perception of our product’s performance is paramount: a slow product is a poor product that impacts our customers’ trust. 
  3. Search Engine Optimized. Through page speed, optimized content, and an improved User Experience, our frontends must employ the proper techniques to maintain or increase our SEO.
  4. Scale. Our frontends must out-scale our traffic, absorbing load spikes when necessary, and deliver a consistent customer experience.  
  5. Resilient. Our frontends will respond to customer requests, regardless of the status of downstream services. 
  6. Accessible. Our frontends will be developed to ensure equal access and opportunity to everyone with a diverse set of abilities.
  7. Quality.  The quality of our experiences should be prioritized to deliver customer value, solve customer problems, and be at a level of performance that meets our SLA’s and reduces customer reported bugs. 

Defining Our Tenets

We set out to define a core set of tenets for this strategy; a core set of principles designed to guide our decision making. These tenets help us to align the vision and decisions against our end goals. I wanted these tenets to be focused on driving the solution to be something that Frontend Engineers want to adopt, not something they must. We need to deliver something that is seductive, makes engineers’ lives better, and in turn is able to directly impact our customers; as engineers are able to move quicker, and have the autonomy and ownership to make decisions.

  1. Developer Experience. Start with the developer and work backwards. Tools and frameworks must enable rapid development. Developing inside the Frontend Strategy must be easy and fast, with limited friction.
  2. Metric Driven. We make decisions through the use of metrics; measuring how our pages and components behave and their latencies to drive changes.
  3. Ownership. Teams control their own destiny from end-to-end. From the infrastructure to the software development lifecycle (SDLC), owning the full stack leads to better customer focus, team productivity, and higher quality code.
  4. No Obstacles. We remove gatekeepers from the process by providing self-service options, reusable templates, and tooling.
  5. Features Over Infrastructure. We leverage solutions that unlock frontend engineer productivity, in order to focus on customer features rather than maintaining our infrastructure. 
  6. Pace of Innovation. We build solutions to obstacles that interfere with getting features in front of customers.
  7. Every Briteling. We build tools and leverage technology that allows every Briteling to build customer facing features. 

Developing Our Vision

Now that we had the challenges, requirements and tenets outlined, we needed to define a vision for this 3 year frontend strategy. Following the tenets, we want to empower Britelings to deliver customer impactful features, and make our customers lives better. We want this vision to be something everyone in the company can get behind, and as such we don’t actually reference Frontend Engineers, instead we strive to empower ALL Britelings to deliver customer impactful experiences.

Vision

Delight creators and attendees by empowering Britelings to easily design, build, and deliver best in class user experiences. 

Next Post we will talk about the Strategy and the architecture.

A day in the life of a Technical Fellow

In my two most recent blog posts, I talked about how to write a Long-Term Technical Vision and a Golden Path. These are future-looking and high-level artifacts so the question I keep hearing is: do I need to give up coding to grow in my career and become a Technical Fellow? In this post I will explain what it’s like being a Technical Fellow and how to strike a good balance between breadth and depth. Let’s also forget about the specific title for a moment, since different companies will have other names such as Distinguished or Senior Principal Engineer. What really matters is the scope and how to be able to cope with it while ensuring that you don’t become a person who’s too detached from the details and provides overly generic feedback and guidance.

Eventbrite has roughly 40 engineering teams and in theory I could say that my scope covers all of them. However, it’s unrealistic to be involved in so many of them and have enough context to provide meaningful contributions to each team. The two critical aspects for making this work are: knowing how to prioritize my time, and being able to delegate. But how did I learn this?

Earlier in my career, I was the tech lead for a small team with two other engineers. Over time the product that we had built was successful and we grew to three feature teams, with me being the uber tech lead for them. At first I was trying to be as embedded into each of them as I was when I belonged to just one team: attending their standups, being part of the technical design reviews, coding, etc. Soon enough I realized that this approach would not scale and I sought feedback on how to manage the situation. One piece of advice that was critical in my career was: “in order to grow, you need to find or grow other people to do what you’re doing now, so you can then become dispensable and start focusing on something else”. That “something else” could be taking on a larger scope or just finding another area to work on, but the key here is that what we should be aspiring to is growing others so that they end up doing a similar job to what we’re doing now, and we should become dispensable in our current role. It is interesting to think that our goal should be to reach a point where we’re almost irrelevant, and that took me time to properly understand, but it’s really key for career growth.

After growing tech leads in the three teams I was overseeing, I could start focusing on the larger picture. However, I didn’t want to become too detached from the lower level details, so I opted for working in a rotating way with the three teams, where each quarter I would become a part-time IC for each of those teams, including coding tasks, designs, code reviews and being on call. And I say part-time because I still had to invest time in my breadth activities and thinking about the long term. I structured my schedule in a way where my mornings would be mostly IC work and the afternoons would be filled with leading the overall organization and being a force multiplier. This dual approach where I oversaw the larger organization but also had time to tackle lower level aspects allowed me to focus on the bigger picture while being attached to the actual problems that teams were facing, and have enough context to be useful when providing them feedback and guidance.

Time has passed and at Eventbrite I now follow a similar model but with a larger set of teams. Since the rotational approach won’t work as well (rotating a team per quarter will take me 10+ years to complete each rotation), we decided to implement a model where Principal Engineers and above (including Technical Fellows) would have different engagement levels with each team, which could be divided into the three categories listed below:

  • Sponsors are part of a team and spend ~2 days/week working with that team, which includes attending the standup, participating in system designs, coding and being on call. We expect Principal+ engineers to sponsor at most 2 areas at any given point in time.
  • Guides spend ~2 hours/week on a given project. They are aware of the team’s mission and roadmap, protect the long-term architecture, provide the long-term direction of the product, and may be active in the code base.
  • Participants are available to a team for any questions they have or to help disambiguate areas of concern, they are active in meetings but may not be deep in the code base. Participants spend a few hours a month on the project/team.

With the above in mind, I am sponsoring two teams right now, and that is expected to rotate based on the teams who will need my involvement the most. As of today this means that I’m more involved in the Ordering and Event Infrastructure teams, including coding, working on technical designs, mentoring others in the team, etc.

So what’s a day in my life look like? 

As I mentioned before, I structure my day so that in the mornings I will do IC work and the afternoons will be for breadth work. Right now my main area of focus as an IC is getting our new Ordering Pipeline implemented and that’s where I spend most of my coding cycles. This is a brand new service written in Kotlin, gRPC and uses AWS technologies such as DynamoDB and Lambdas. It’s particularly critical not only because Ordering is at the core of Eventbrite, but because it’s paving the way for the new generation of services that we’re starting to build in the company, since this is the first one with the technologies and processes outlined in the 3-Year Technical Vision and the Golden Path. And such, many other services who will follow will use what Ordering is building today as their reference architecture, and we’re also finding a few unpredicted gaps that we have to solve before other teams find them. I was also on call for this team a couple of weeks ago.

In contrast, my afternoons are typically filled with breadth work, that is, with 1:1s, syncs with other people in Argentina or the US, company tech talks, design reviews, and others. For example, I was recently heavily involved in coming up with a new engineering career guide for the company (which we’ll blog about at some point), or attending leadership syncs with our CTO and CPO about the current state of our Foundations and the challenges ahead of us.

As time passes my focus will move away from Ordering to other areas where I can contribute in depth, and by then I will have expected to grow the team to a state where they don’t miss me and they can keep moving forward without my help. Breadth work is there to stay and can be very different each week depending on what the company needs the most at that particular moment.